
61.8 per cent of those who voted in the voluntary postal survey, voted Yes, with 38.4 per cent voting No. Most of the No votes came from electorates in Western Sydney (11 out of the 17 electorates that voted No are from this area) which are demographically multicultural.
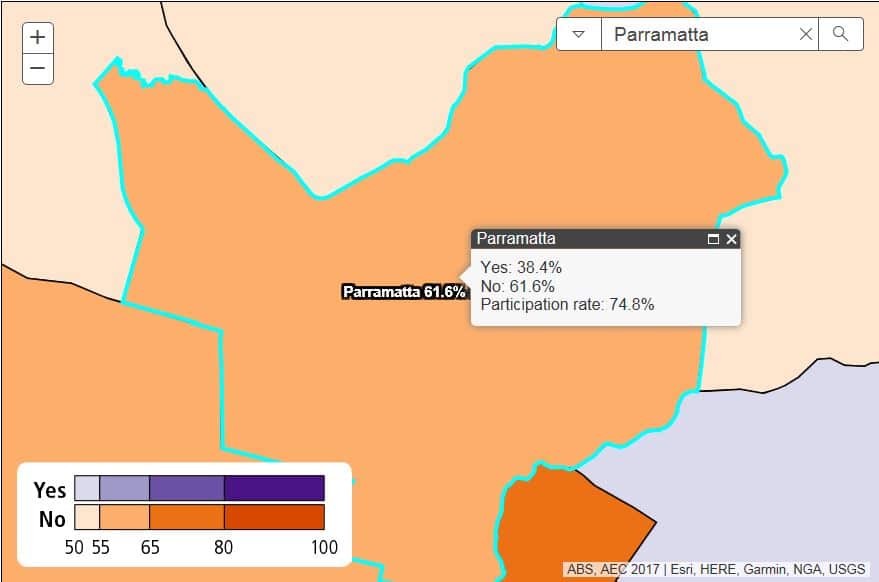
Parramatta, which has huge Indian community, has voted in a clear No. 74.8% people voted in this area with 61.6 saying No. Only 38.4% voted in favor of same-sex marriages.
Nitin Setia voted in Parramatta and he is against same-sex marriages. A restaurateur in Parramatta, Setia believes that sometimes old is better. “We are going in a wrong direction. We need a man and a woman to reproduce. It is the basic principle and should not be challenged,” said Setia.
The picture is not the same in other parts of the country. More than half (56.8%) voters in Wyndham, Victoria voted in favor of same-sex Marriages. The number of No voters stood at 43.2% as the participation rate was 77%.
In Queensland, areas with high Indian population did not see a vast gap in Yes and No voters. 54.6% voted Yes while 45.4% are against same-sex marriages in Rankin. Moreton, another suburb with higher Indian population voted in favor of Yes. 60.9% voters said they want same-sex marriages to be legalized while 39.1% opposed it. The participation rate here was 79.6%.
Liverpool, another multicultural area in New South Wales has more ‘No’ voters. With a participation rate of 72.4%, only 36.3% voters voted in favor while 63.7% are against same-sex marriages.
Most of the suburbs with higher Indian population in Western Australia voted in favor of Same-sex marriages. Curtin (72%), Swan (64.7%) and Wentworth (80%) had a strong swing in favor of Yes vote.
These stats should be taken as indications only and in no way suggest how any particular community has voted.