In Brief
- Australia's ninth housing downturn in 30 years is here — but analysis suggests it won't last.
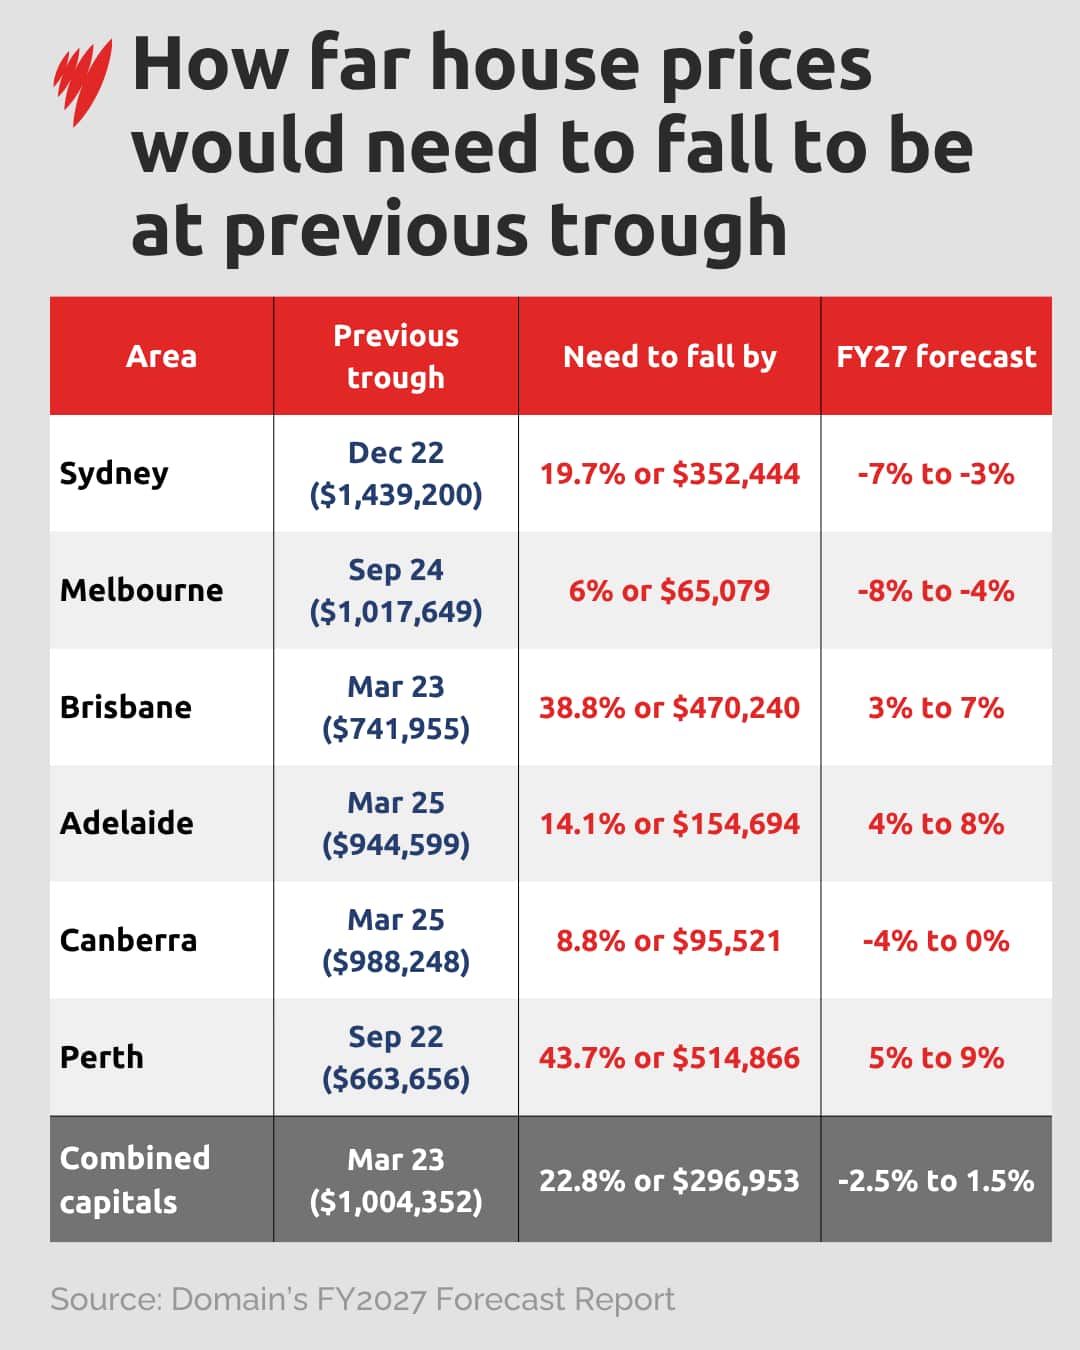
- Prices would need to drop by 22.8 per cent to undo the gains of the past three years.
Australia's housing market is falling. But if we look at the history books, it's just business as usual, according to new analysis from Domain.
Following the government's budget changes to negative gearing and capital gains tax, and three consecutive interest rate rises this year, housing values across the combined capitals have started to slide.
Whenever that happens, both buyers and sellers can be left wondering: how much further could prices fall? Should sellers hold off — and should buyers capitalise now? When exactly is the bottom?
New Domain analysis suggests the answer to that question may be hinted at in historical data from the past thirty years.
Just another downturn?
News that makes sense
Your trusted source for staying up-to-date with the world around you. Get free daily news updates and analysis, straight to your inbox.
The market has entered its ninth downturn in three decades — but Domain's FY2027 Forecast Report found a consistent pattern: every one of the previous eight downturns has been followed by recovery, eventually pushing prices to a new high.
For prices across the combined capitals to fall back to their previous low in March 2023, they'd need to drop by around 22.8 per cent, the analysis found.
Their current forecast has Sydney house prices falling by as much as 7 per cent and Melbourne by as much as 8 per cent over the next financial year — nowhere near enough to undo the gains of the past three years.
The analysis highlighted that what stood out about Australia's last eight downturns wasn't the falls themselves; it was how contained they had been. In every single one, the worst annual fall stayed under 8 per cent.
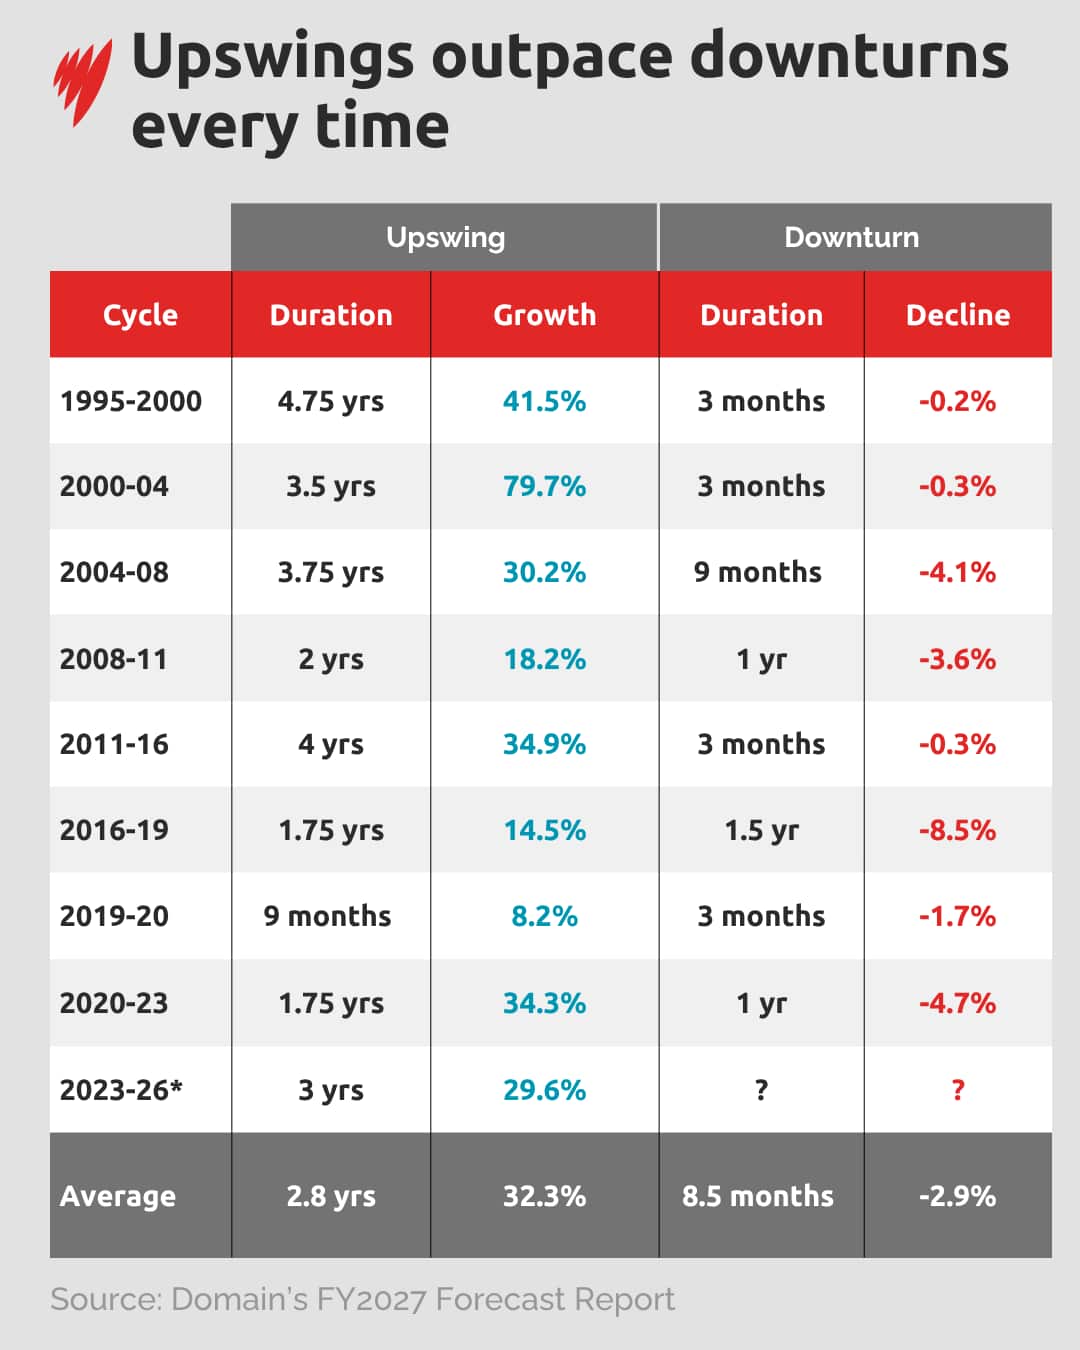
The upswings were also telling, with Australia going through nine separate growth phases since 1995, lasting an average of just under three years but delivering average growth of 32.3 per cent.
The most recent upswing, which lasted three years and is now ending, saw house prices rise by 29.6 per cent.
"While the latest slowdown comes amid heightened focus on government policy, three decades of data show housing downturns have occurred under all policy settings, and have consistently been driven by interest rates, supply, credit conditions and shifts in confidence," the Domain analysis reads.
"Across that period, Australia has recorded eight completed downturns — each followed by a recovery that not only reversed losses but pushed prices to new highs."
How long will the dip last?
While you might need a fortune teller to predict the lowest low, Domain's historical analysis suggests things might start heading up next year.
"Downturns have typically been short and contained, averaging a 2.9 per cent decline over around eight months," the analysis found. "By contrast, upswings have been longer and significantly stronger, delivering 32 per cent growth on average over nearly three years."
Domain chief residential economist Nicola Powell said the underlying rhythm of the market hasn't changed.
"Downturns can feel sharp in real time, but historically they’ve been short and shallow, and have not unwound the gains that preceded them," she said.
"When the interest rate cycle turns, demand that has been sitting on the sidelines tends to return quickly, bringing the next phase of growth forward."
How to tell when the market is on the upswing
So what should buyers and sellers be watching for?
Interest rates are the first and most obvious signal, according to REA Group senior economist Anne Flaherty.
"Once we've seen that rates have hit the peak and the overwhelming consensus is that the next move is down, that normally signals a turning point," she told SBS News, adding that undersupply and slow construction across most capitals are keeping confidence in the market's medium-term trajectory.
Auction clearance rates are another key gauge.
They're currently sitting close to 40 per cent in capital cities, according to Cotality research this week, meaning fewer homes that have gone to auction have found a buyer.
Clearance rates above 60 per cent are typically seen as a mark of a balanced market.
"Once we start to see the clearance rates pick up, that's a sign that buyers and vendors are more aligned and it's also a sign that buyer demand is recovering," Flaherty said.
"It's also when we start to see more people turning up for open home inspections and more people searching and inquiring to buy property," she said, noting that it typically takes longer for that interest to flow through into actual price growth.
Spring is likely to be the next real test, with winter being a traditionally quieter period for listings, Flaherty said.
By then — and with the dust from the federal budget settling — there should be a clearer idea of where buyer demand sits.
For the latest from SBS News, download our app and subscribe to our newsletter.
