

Australia has failed its most disadvantaged communities, with entrenched disadvantage keeping the most down-and-out communities at the bottom.
The Dropping off the Edge 2015 report has identified the most disadvantaged areas in every state and territory in 2014, finding that recurring disadvantage was more acute in some areas where people face multiple challenges.
Many of those communities are the same ones identified eight years ago in the 2007 Dropping Off The Edge report.
"Sadly, the current report drives home the enormous challenge that lies in front of our policy makers and service providers, as many communities identified as disadvantaged in 2007 once again head the list in each state and territory," the 2015 report says.
It recommends a federal body be established to identify and assist Australian communities with high social needs and concentrated disadvantage.
News that makes sense
Your trusted source for staying up-to-date with the world around you. Get free daily news updates and analysis, straight to your inbox.
"In every jurisdiction there is a marked degree of spatial concentration of disadvantage," the report says.
People affected by one factor, like unemployment or housing stress, are often affected by others the report said.
“Disadvantages tend to concentrate among the same people and their effects on health and life opportunities are cumulative,” the report says.
The report used various indicators, like internet access, overall education, criminal convictions and domestic violence to measure disadvantage.
The report found:
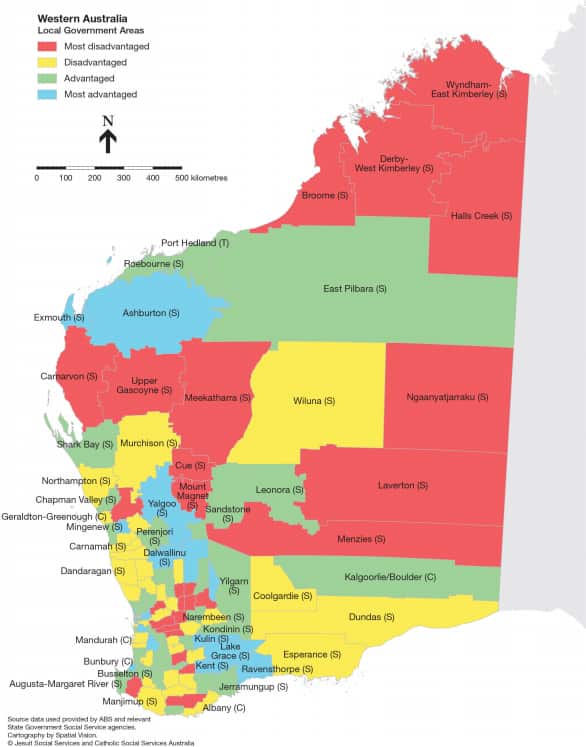
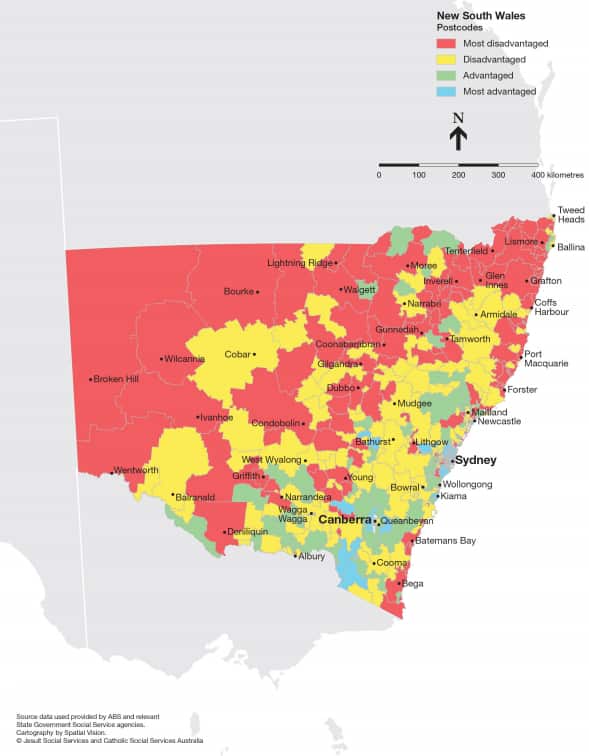
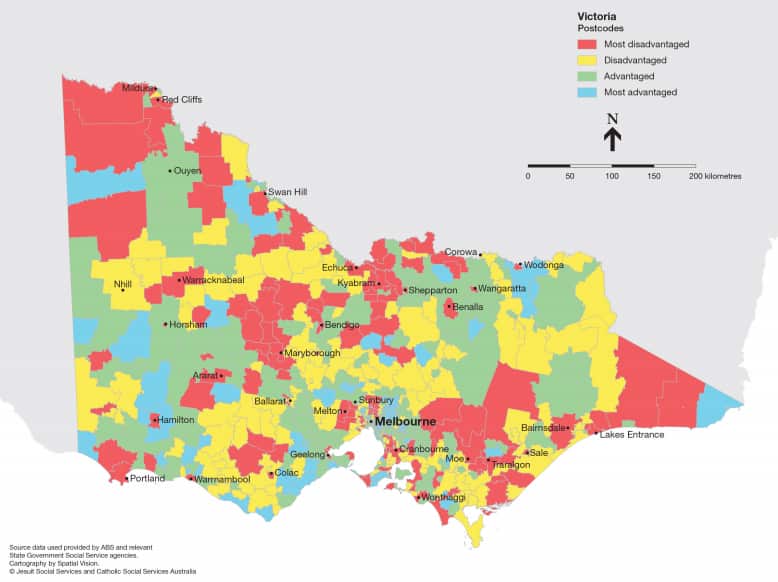
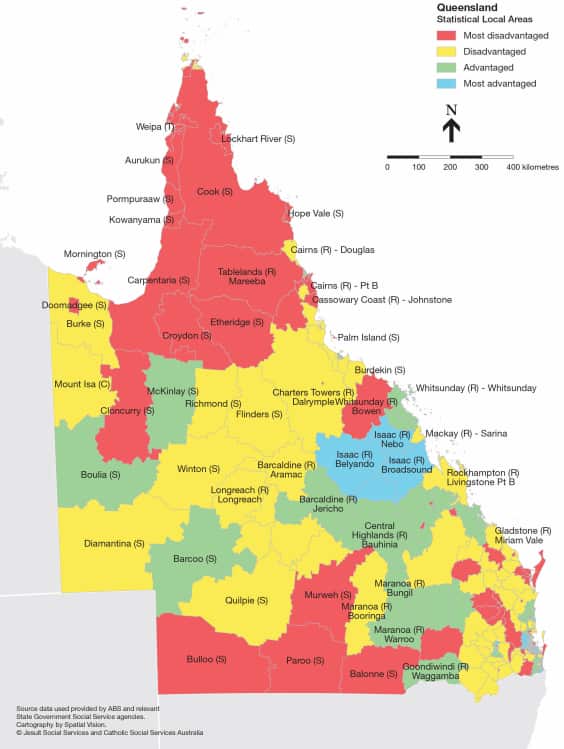
Queensland: 6% of SLAs accounted for half of the top five per cent ranks on the indicators. South Australia: 5.5% of SLAs accounted for more than half of the top 5% ranks on the indicators. NSW, Victoria & WA: 1.5% of postcodes accounted for 12-14%of the top 5% ranks on the indicators.
Anglicare Australia has expressed concern that whole communities in Australia were being left behind due to exceeding disadvantage.
"Recurring characteristics within these disadvantaged communities include criminal convictions, long and short term unemployment, disabilities, lack of formal qualifications, deficient education, low family incomes, domestic violence and mental health problems," Anglicare Australia acting executive director Roland Manderson said.
The report was commissioned by Jesuit Social Services and Catholic Social Services Australia and was authored by Professor Tony Vinson, Associate Professor Margot Rawsthorne, Dr Matthew Ericson (all of University of Sydney) and Dr Adrian Beavis of the Australian Council for Educational Research.
The report identified the most disadvantaged local government areas (LGAs), postcode areas or statistical local areas (SLAs), listed alphabetically.
New South Wales (‘disadvantage factor’ by postcode)
2839 - Brewarrina
2559 - Claymore
2834 - Lightning Ridge
2832 - Walgett
2836 - Wilcannia
2306 - Windale
Victoria (‘disadvantage factor’ by postcode)
3047 - Broadmeadows
3214 - Corio
3177 - Doveton
3200 - Frankston North
3465 - Maryborough
3840 - Morwell
Queensland (‘disadvantage factor’ by SLA)
Aurukun
Doomadgee
Kowanyama
Mornington
Woorabinda
Yarrabah
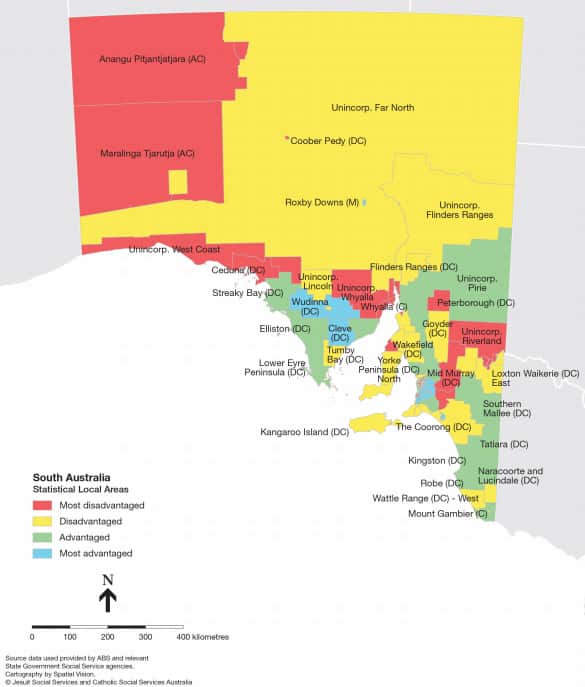
South Australia (‘disadvantage factor’ by SLA)
Anangu Pitjantjatjara
Coober Pedy
Maralinga Tjarutja
Peterborough
Playford – Elizabeth
Unincorporated Whyalla
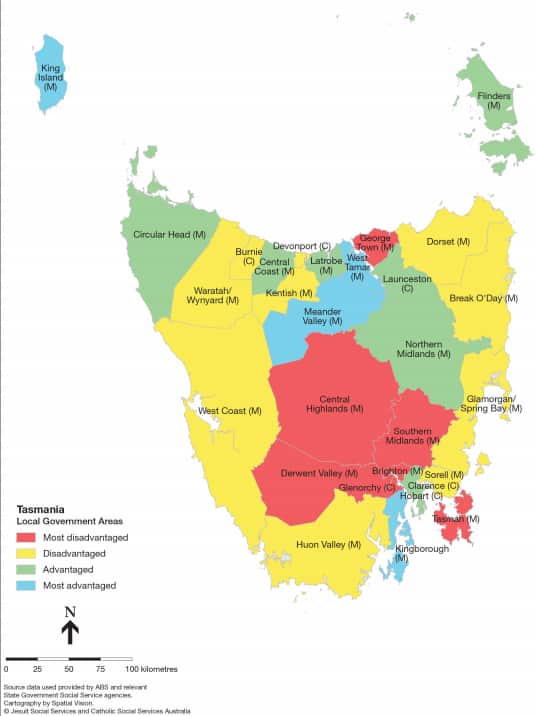
Tasmania (‘most disadvantaged’ by LGA)
Break O’ Day
Brighton
Central Highlands
George Town
Tasman
Western Australia (‘most disadvantaged’ by LGA)
Derby-West Kimberley
Halls Creek
Katanning
Menzies
Mt Magnet
Ngaanyatjarraku
Upper Gascoyne