
In brief
- New Australian Bureau of Statistics data reveals 25 October was the most popular wedding date last year.
- It also found the marriage rate continued to decline, and the divorce rate ticked up for the first time in years.
Saturday 25 October was Australia's favourite day to say "I do" in 2025 — but new data suggests fewer couples are saying it.
Fewer Australians tied the knot last year than the year before, according to new figures from the Australian Bureau of Statistics.
At the same time, more marriages are coming to an end, with the divorce rate ticking upward for the first time in several years, though ultimately remaining lower than it was 20 years ago.
The most popular day to get hitched
The most popular wedding date in 2025 was Saturday 25 October — i.e. the symmetrical 25/10/25 — with 2,035 marriages.
News that makes sense
Your trusted source for staying up-to-date with the world around you. Get free daily news updates and analysis, straight to your inbox.
That's about 500 more than the runner-up, Saturday 22 November (22/11/25) — which had 1,527.
ABS data show there's somewhat of a trend towards more marriages on dates with numerical significance, though for some it could also be coincidence.
The least popular days were Christmas Day, with 51 weddings, Boxing Day with 54, New Year's Day with 57, and Tuesday 29 July with 61.
Spring dominated the wedding calendar, with most of the top ten dates falling in September, October and November. The rest were scattered across autumn.
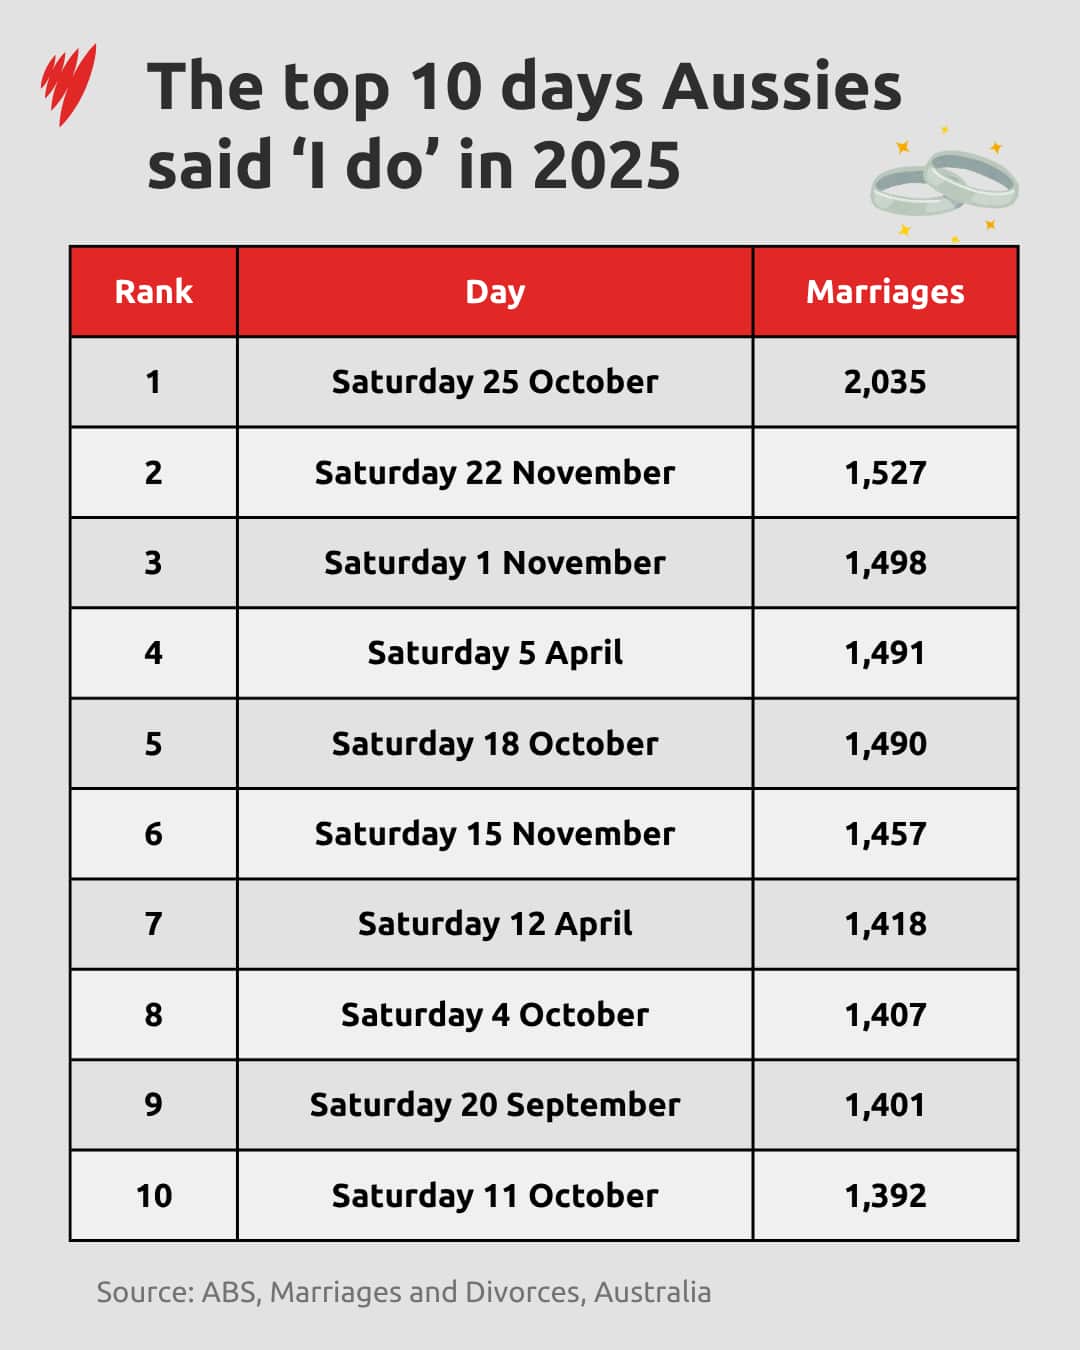
Saturday remains, unsurprisingly, the nation's preferred wedding day — more than 52,000 marriages took place on a Saturday in 2025, and 45 of the year's most popular dates fell on one.
Friday came in second, with just over 21,000 marriages, led by Friday 10 October (10/10/25).
Zoom out further, and one day still reigns supreme: 10 November 2012 — the sequential 10/11/12.
That remains the most popular wedding date of the past 20 years, with 3,081 marriages recorded on that day — still comfortably ahead of the runner-up, 11 November 2011 (11/11/11), which had 2,614.
Fewer couples tying the knot
Beyond the calendar quirks, the broader numbers tell a clearer story: marriage is becoming less common in Australia.
There were 118,804 marriages registered in 2025 — 2,040 fewer than in 2024, a drop of 1.7 per cent.
That's in line with 2023's total (118,439), but still well above the pandemic-era lows of 2020 and 2021.
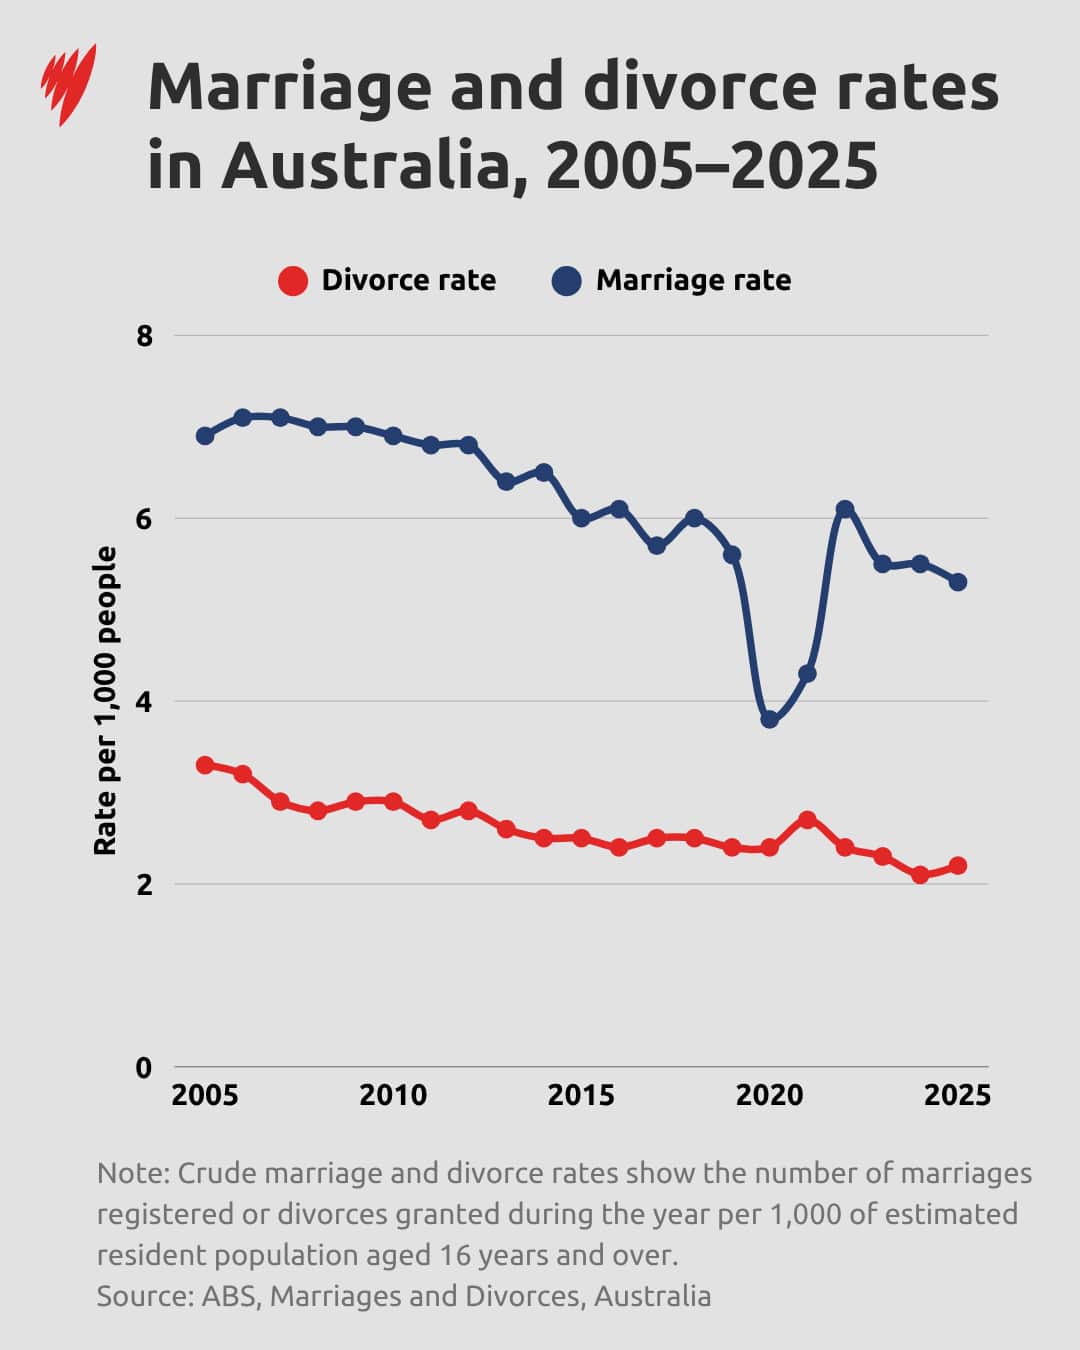
Adjusted for population, the marriage rate — the number of marriages per 1,000 people aged 16 and over — fell slightly to 5.3 in 2025, down from 5.5 in both 2023 and 2024.
Zoom out to 2005, where the marriage rate was 6.9, and the decline is even more stark.
The biggest drops came among 25-29 and 30-34 year-olds. No age group recorded an increase.
Despite the falling numbers, the age at which Australians marry has barely moved: 32.7 years for men (down marginally from 32.8 in 2024) and 31.2 years for women, unchanged for the third year running.
Same-sex and non-binary marriages held steady too, making up 3.9 per cent of all marriages for a third consecutive year. More marriages were between two women (2,527) than two men (1,849).
More couples calling it quits
On the other side of the ledger, 49,158 divorces were granted in 2025, a 4.1 per cent rise on 2024's 47,216.
That brings the total roughly back in line with 2022 levels (49,241).
The divorce rate — divorces per 1,000 people aged 16 and over — rose to 2.2, up from 2.1 in 2024.
But the bigger picture across two decades reveals fewer people are getting divorced: in 2005, the divorce rate was 3.3 per 1,000 people, compared to 2025's 2.2 figure.
Australians are also divorcing slightly later in life: the median age at divorce rose to 47.3 years for men and 44.4 for women, both up marginally on 2024.
But marriages that do end are lasting longer before couples separate — a median of 9.4 years in 2025, up from 9.3 the year before.
That data suggests Australians may be walking down the aisle less often each year, but marriages may be proving more durable than they were two decades ago.
For the latest from SBS News, download our app and subscribe to our newsletter.