in brief
- New research proves having a mortgage is now more difficult than ever.
- The baby boomer myth of more challenging historical conditions does not hold up.
A long-standing generational myth has been mathematically debunked by new analysis from KPMG, which shows that households are under greater mortgage pressure now than during the legendary interest spike of the late 1980s.
The financial services company looked at historical Australian Bureau of Statistics (ABS) data and found households are now facing one of the heaviest interest burdens on record — experiencing tougher conditions than when the Reserve Bank of Australia (RBA) cash rate reached 17.5 per cent in 1989.
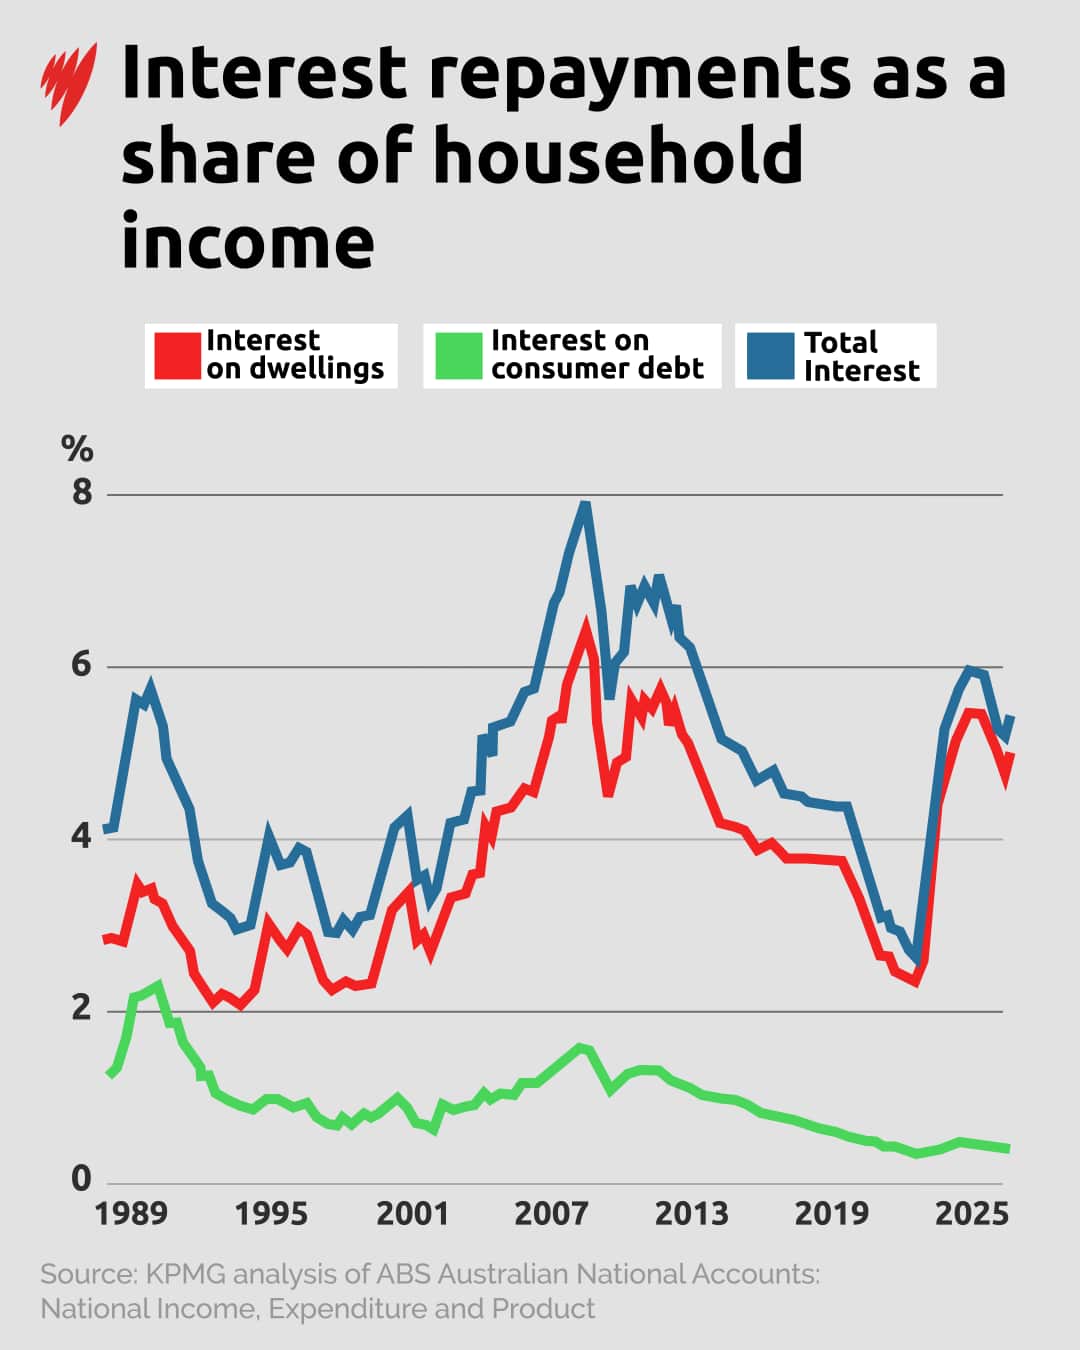
Interest payments on debt as a percentage of household income reached a peak of 5.7 per cent during the 1989-1990 inflation spike.
In 2023, that peak was 5.9 per cent.
The second quarter of 2026 saw repayments creep back up to 5.4 per cent and are positioned to keep rising.
News that makes sense
Your trusted source for staying up-to-date with the world around you. Get free daily news updates and analysis, straight to your inbox.
"Things are tougher now than at that 17 per cent period," director of planning and infrastructure economics at KPMG, Terry Rawnsley, told SBS News.
The KPMG analysis looked at the ratio of interest payments to total income as an average across all households, not just those with home loans. It took in credit card interest payments and personal loans over the last 40 years, with the ratio reflecting interest payments, not principal repayments.
Primarily, the key difference between now and the 1980s is house prices.
While today's interest rates are much lower — the RBA held the cash rate to 4.35 per cent in June — the size of the loan that that interest is paid on is significantly higher.
"If you've got a mortgage at 17 per cent, and that mortgage is $100,000, you're paying the same interest if you've got a $400,000 mortgage at 5 per cent," Rawnsley explained.
"It's not just about the interest rates, it's about how big the home loans have had to get for you to get into the housing market, which is driving up the interest-to-income ratio."
The national average home loan size for owner-occupiers in Australia is $735,000, according to financial comparison group Canstar.
The average variable interest rate for borrowers is 5.93 per cent, making the average monthly repayment now $4,300.
Associate professor Ben Phillips is an economics and social researcher at the Australian National University. He told SBS News that, while 5.9 per cent may not sound like much, it is derived from the roughly 35 per cent of the population who have a mortgage — a much higher proportion than in the '80s.
While there are more people with a mortgage today, Australia is a much wealthier, much higher-income country as well, Phillips said.
"Living standards are much higher, so we can wear higher repayments," he said.
Victorians paying more
Households in Victoria are paying the highest interest repayments as a proportion of household income in the country, at 6.9 per cent.
Rawnsley explained that improved housing affordability over the past five years has actually left Victorian homeowners more exposed.
"We've got more people in Victoria in home ownership than the other states, so that's kind of a good sign," he said.
However, as the RBA is "trying to manage sort of economy-wide inflationary pressures by just whacking a smaller group," Rawnsley expects Victorian homeowners are "probably feeling the impact of each interest rate [rise] more and more".
This is compounded by the fact that first home buyers typically have larger mortgages and higher debt burdens relative to their incomes.
South Australia (5.7 per cent), NSW (5.6 per cent), Queensland (5.5 per cent), and Western Australia (5.3 per cent) are all below the national average of 5.8 per cent.
The ACT, Tasmania, and the Northern Territory have interest repayments of less than 5 per cent, which reflects their lower home prices, but also lower home ownership rates.
Comparing 2024-25 to the historical lowest in 2021-22, Victoria saw the largest increase (3.8 percentage points), followed by NSW and South Australia (3.0 percentage points).
Who had it worse?
The toughest burden on households has largely been carried, not by baby boomers, but by gen X, according to the analysis.
During the global financial crisis (GFC), interest as a share of income peaked at 7.9 per cent in June 2008 when the cash rate was 7.25 per cent.
For almost a decade between September 2005 and March 2013, interest repayments averaged 6.6 per cent of household income.
"That gen X cohort, coming in around the GFC had a tough period for sure," Rawnsley said.
"Then the most recent period we've seen in the last 18 months is pretty tough as well. That 17 per cent period sneaks in just in the third spot."
Australia has grown wealthier as a nation since the '80s, with salaries rising significantly; however, the KPMG analysis takes this into consideration.
What has not kept pace is the ratio of house prices to annual wages. In the '80s, a home loan was typically 2.5 to 4 times a household's annual income, and a 20 per cent deposit needed only two-thirds of an annual salary, data from financial comparison site Finder shows.
Today, average house prices are roughly 8.2 times the median household income. In Sydney, where affordability is amongst the lowest in the country, house prices are 13.8 times the median household income.
That said, Phillips argues that, while the "deposit gap" has made housing a more challenging landscape for first home buyers, "once you're in, I don't think things are necessarily any more difficult than they were in the past".
"It's true that probably there are some households that are at more risk, because you've got a high level of debt, but it doesn't seem to be filtering through to any of the serious consequences," he continued.
"As long as you're able to repay your loan, which at this stage anyway most people seem to be able to, it's not really a problem."
Rawnsley argues that, unlike Americans where bankruptcy was commonplace during the GFC, "Australians really will do everything they can to kind of hold on to the home loans".
"They'll be cutting back on discretionaries, they'll be cutting back on all sorts of things, they'll be getting second jobs," he said. "We've kind of seen that happening already."
The persistence of the 17 per cent myth
While mathematically the period of the highest household mortgage stress was during the GFC, followed by the present, Rawnsley argues that point has been lost in public discourse.
"In 2009, interest rates were 7.25 per cent, but that just doesn't sound very impressive," he said. "Seventeen per cent is just numerically bigger. It has a bit more shock value."
In addition, the rates paid by gen X remained high for years, meaning borrowers may simply have got used to it.
"It also might be a bit of a generational issue that maybe the gen Xs don't articulate their complaints," Rawnsley said.
Phillips also argued the historical context plays a part in upholding the narrative.
The GFC, as it was rolling across the globe following the sub-prime mortgage lending crisis in the United States, was predicted in the media at the time to hit Australia much harder than it did.
"It was all relative to what we're seeing in other countries," he said. "They looked terrible and we were probably a shining light of fiscal and monetary policy through that period."
For the latest from SBS News, download our app and subscribe to our newsletter.
