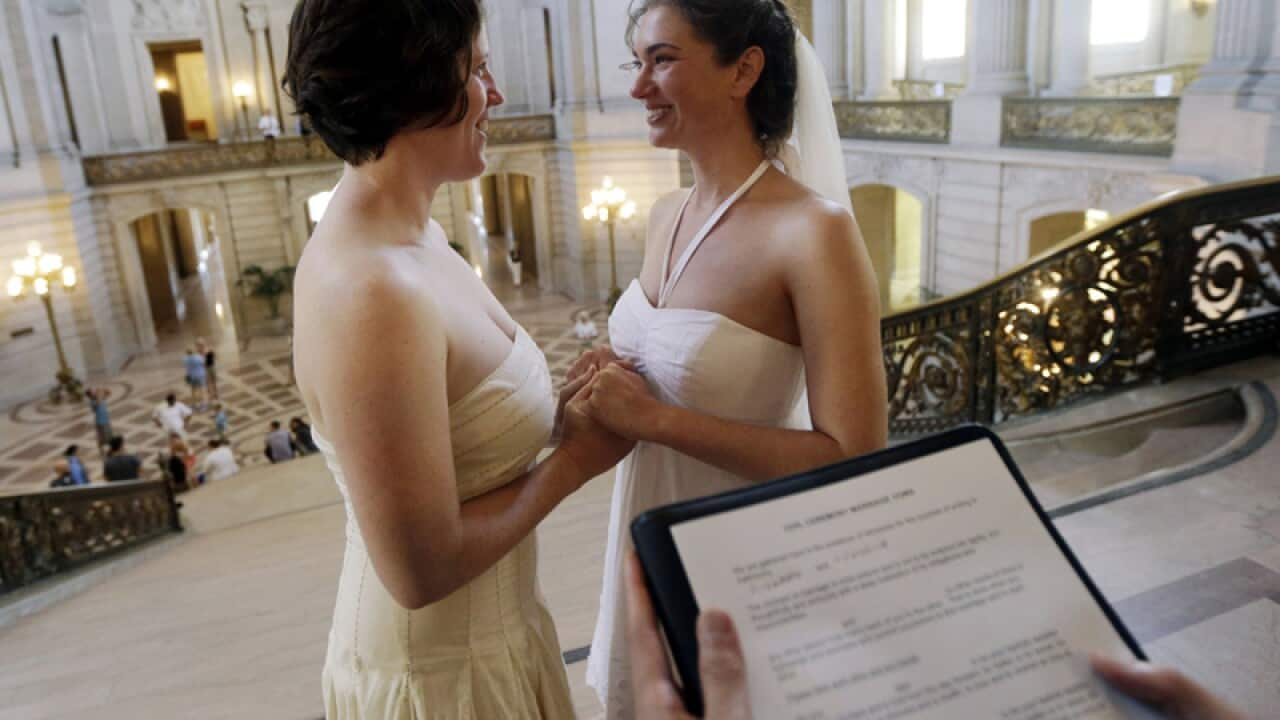
There were 33,700 same-sex couples in Australia in 2011, a 32 per cent increase since the 2006 Census, representing 1 per cent of all couples in the country.
17,600 were in male same-sex couples, 16,100 in female.
Interestingly, the age difference of those people in same-sex relationships was greater than that in opposite-sex relationships.
The age gap for female same-sex couples was an average of 4.8 years, while for males that difference was 6.5 years. The gap average for opposite-sex relationships was 3.7 years.
Furthermore, in around a quarter of male same-sex relationships, there was an age difference of 10 years or more.
More same-sex couples are also having children, with 6,300 kids living with same-sex couple families, up from 3,400.
The ABS says people in same-sex relationships tend to be more highly educated, have higher labour force participation rates, and have higher personal incomes than opposite-sex couples.
Around 67 per cent of male same-sex couples, and 58 per cent of female same-sex couples had a combined household income of $2000 or more per week, compared with 42% of opposite-sex couples.
The ACT had the highest rates of both male and female same-sex couples of any state or territory, but in terms of number, 32 per cent of the nation's same-sex couples live in NSW.
The top 10 suburbs for male and female same-sex couples were all in inner Sydney.
Of all couples living in Darlinghurst, 17.9 per cent were in male same-sex relationships, 17.8 per cent in Potts Point, 17.3 per cent in Surry Hills, 16.3 per cent in Elizabeth Bay and 14.5 per cent in Redfern.
Female same-sex couples, form 6 per cent of all couples in St Peters, 5.7 per cent in Newtown, 5.4 per cent in Erskineville, 5.3 per cent in Enmore and 4.2 per cent in Lewisham.
Share

